
Do Ads Work? (And How Can You Tell?)

by James Blatch
Despite overwhelming evidence in the SPF community that paid ads drive the sales of indie books, it’s still a reasonable question to ask – not least because the market we operate in, and the ads platforms we use, are subject to change.
Mark was able to show afresh that ads work when he entered the German market last year. With no established presence in Germany, he was on a par with many of us who have books to sell. He reported on the positive results in a podcast episode here.
We had another excellent opportunity to test the theory earlier this year. Mark and I formed our own imprint, Fuse Books, and took over the rights to the six books in Robert Storey’s Ancient Origins series. Robert tragically died in March 2019, and we had been helping his parents set themselves up to continue his marketing efforts. They are retired, however, and while keen to see Robert’s books flourish, they couldn’t quite see themselves as indie publishers.
We proposed a deal. We would market the books and share the profits 50/50.

Looking at the historical data from Robert’s KDP account, it seemed he stopped running ads in the autumn of 2018. His sales declined rapidly at first and then by about 10% each subsequent month.
So why was this such a golden opportunity to test the power of ads?
Because benchmarking.
Assessing the effectiveness of your ads is hard. Facebook has no direct contact with Amazon for tracking purposes, and it can therefore only report on impressions and clicks, not sales. Some tracking is possible using Amazon affiliate links, but this breaks the terms of service and is not 100% reliable.
Even more frustrating are Amazon Ads themselves. Despite being part of the same ecosystem that sells the books and page reads, attributing sales is still extremely difficult. Firstly, at the time of writing, the Amazon Ads dashboard does not report on attributed page reads if your books are in KU (Kindle Unlimited). Secondly, it doesn’t take into account read-through – the value to you of someone buying one of your books, knowing that a percentage of readers will go on to purchase more.
WHAT IS BENCHMARKING AND WHY IS IT SO IMPORTANT FOR AUTHORS?
Once you know what your book sales look like without ads you can say, with some certainty, how much extra money your ads are bringing in. You will be less certain of which particular set of ads produced which sales, but in broad terms you’ll know whether your campaigns are doing what they’re supposed to do: increase sales and profit.
We took over Robert’s books on the 1st Feb and, for the first time, I watched the Amazon Ads for Authors course – not to edit it for other authors, but to learn the platform myself.
Looking at Robert’s KDP data, I could see that by January 2020 monthly royalties earned was down to $2,491.92. Using the average rate of decline, I could predict that sales for February would be less than $2,300. However, to err on the side of caution and avoid attributing sales to ads that might have occurred anyway, I decided to use January’s figure as my benchmark.
ANCIENT ORIGINS BENCHMARKS FOR FIRST SIX MONTHS

I learned from Janet Margot in the new Amazon Ads course that it’s important to update your benchmarks over time. And so, at the six month point, I will reset the figures based on my base level of advertising and attempt to scale up further from there.
It became time to launch my own ads campaigns. I should tell you, I was nervous. I’ve had a grandstand view of this process over the last couple of years, but suddenly here I was at the helm of real books and real ad campaigns. It was time to take the plunge.
February did not start well.
Starting only with Amazon Ads, I ran some experimental automated campaigns and started my first keywords campaigns. I quickly splurged $1,000. Although I could see sales start to rise, the additional revenue did not cover the money spent on ads.
February Results:

I had made a ‘loss’ on advertising of $245.22. In terms of profit to split with the Storeys, I had accelerated the decline rather than reversed it, with only $2,111 to divide between us.
However, by the end of February I had shut off the automated campaigns, spent a few hours carrying out keyword research, and had enough search term data to help shape the manually targeted campaigns for March.
Search terms are different from keywords and, for the first time, I properly understood this. Search terms are what Amazon users type into the search box, whereas keywords are phrases we come up with to try and match those searches. Inside the Amazon ads reporting, you can get a list of the search terms that your campaigns matched with your keywords. Using this valuable data, you can base new campaigns around the actual searches people use that led them to purchase your books.
March turned out to be our first profitable month when ads spend was compared with revenue above benchmark.
March Results:

To my relief, we had an overall profit of $2,821.01 – some $340 higher than the profit we inherited. The decline had reversed.
Without the automated campaigns running away with my budget, the targeted campaigns spent less but achieved better results. That’s not to say the ‘loss’ making campaigns from February were wasted, as I used the data to shape the campaigns of March.
Going into April, my aim was to scale up what I knew to be profitable campaigns.
It’s worth pausing for a moment here to reflect on the key influence of benchmarking. According to my Amazon Ads dashboard, my ACoS (the measure of return for your ad spend) at the end of March was 599.95%. According to Amazon, I was making a significant loss on my ads.
But I knew that was not the case. There was nothing magical that happened in March beyond me running Amazon Ads to Robert’s books. Left to their own devices, it’s highly likely the royalties would have continued to slide, probably down to the $2,100 mark. Instead we saw additional royalties above that of $1,200, for an ad spend of less than $500.
This is a crucial point. Even if you do not understand how to calculate read-through accurately (who does?), benchmarking is a simple method for proving your campaigns’ real-world effect on sales. By taking a measure before you embark on new ads, benchmarking will prevent you turning off profitable campaigns. This is particularly useful when the dashboard is throwing a telephone number ACoS score in your face and telling you that the campaign is losing money.
In April, Stuart Bache worked in the background to produce new covers for the books and I looked to scale up our Amazon Ads spend. It was hard, as others have noted. You get charged per click, so to scale up means putting effort into your targeting to catch those user searches. I managed to nudge up ad spend to $610.01, and we were rewarded by a further rise in sales with royalties of $3,568.98. That’s revenue above benchmark of $1,131.50.
Again, my ACOS on the dashboard for April was high: 684.41%. Without benchmarking, I may well have given up on Amazon Ads at this point.
In May we launched the fab new covers:

I also started Facebook Ads on the 14th of that month.

It was clear from the first couple of days of running Facebook ads that this was going to be a fertile area for investment. I began tracking ad spend and revenue on a daily basis, creating my own spreadsheet with built-in benchmarking for comparison. You’ll note that on some days the campaigns showed a loss without read-through factored in. It’s important to work on trends rather than individual days.
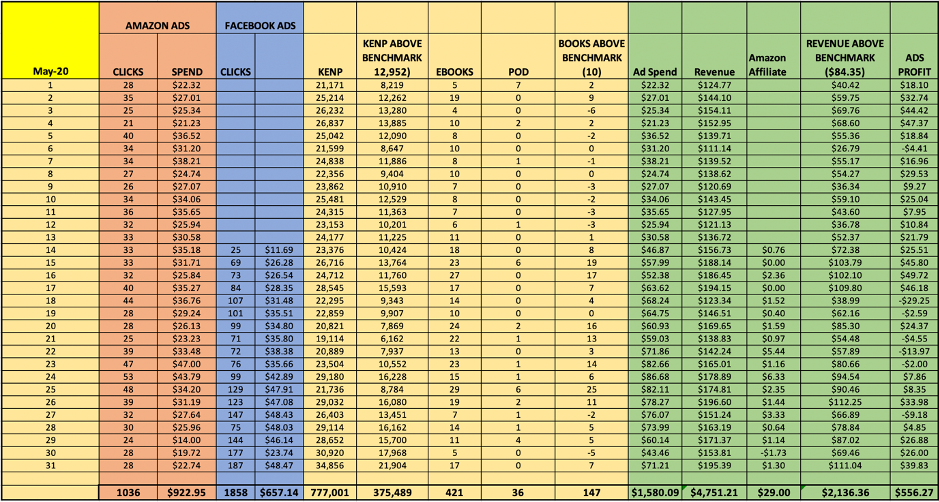
By the end of May we had royalties of $4,751 for the month, with an ad spend of $1,580.09. According to benchmarking, that’s a profit on ads of $556.
With the new covers in place I applied for a BookBub featured deal and, in a moment that made Mr Dawson raise an eyebrow, I was awarded one at the first time of asking. It was, however, an international deal, so it didn’t include the US. The deal cost $170 and I lowered the price of book one to $0.99. We were now averaging about 15 ebook sales a day and 28,000 page reads. The deal went live on the 3rd June – over that day and the next we shifted 459 ebooks.
Page reads really started to climb after that, and I started to scale up the Facebook campaigns in response. I’m writing this blog on July 1st having totted up the results for June:

I was feeling the benefit of read-through from previous weeks’ advertising and the significant BookBub bump. Our ads were now showing a profit every day and that amounted to $2,045 by the end of the month.
When we began, I could not have predicted that by June I’d be spending more than $150/day, confident that the campaigns were delivering a profit.
Benchmarking is a critical part of my approach. Understanding when to ignore the dashboard, particularly the Amazon Ads ACoS, should be part of your strategy.
I produced a chart for this blog and, as it turned out, it was an excellent exercise in assessing ads performance in its own right.
You’ll see that ‘profit’ tracks along with revenue for the months before we took over the books. That’s because there was no ad spend, so all revenue was profit (excluding other costs, of course). When shown like that, it reminds me that the work I’ve done so far has only just got them above where they were back in May 2019, although they were on a decline at the time.
I can also see graphically that as ad spend goes up, it’s become a smaller percentage of revenue, which is excellent as it gives me the confidence to continue investing in the campaigns and maybe get beyond $200/day in July.

In May we also sold the audio book rights to Tantor, and so it gives me great pleasure to pass on a royalties cheque of almost $10,000 to Robert’s parents today knowing that, when we get paid for May and June, the sums will keep rising.
Oh, and if anyone asks – yes, ads work.

James Blatch
James Blatch is co-host of the Self Publishing Formula podcast. He is a former BBC Television News reporter and is currently writing his first novel, a military thriller set in 1960s Britain.